Descriptive statistics and the frequency distribution
Contents
check_boxLearning Objectives
bookModule resources & links
webSetup your workspace
extensionCore Concept: while() looping
motorcycleExercise 1: Gathering primary data from your peers
buildMini Project: Comparing parcel values in two municipalities
Learning objectives |
|
bookExternal Resources
Featured resource: Statistics with Dana Lee Ling in Micronesia
A statistics teacher with a philosophy similar to technology rediscovery classes has written an extensive guide introducing basic statistics concepts using open source tools. His book is released under the Creative Commons Attribution license 4.0, which allows for reproduction and editing of works.
- Online box plot image creator

- Descriptive statistics on Wikipedia
- Standard deviation on Wikipedia
- The Libre Office calc guidebook (600+ pages for free!)
- Array Functions in Libre Office Calc
- Using the array function frequency() in Libre Office calc
- School discipline data: PA Counties only (spreadsheet)
- School discipline data: All 2014 data
- Civil rights data collection (CRDC)
arrow_upward back up to contents
webSet up your workspace
- You'll need only a spreadsheet program of your choosing: Libre Office's Open Source spreadsheet Calc, OSX Numbers, Microsoft Corporation's Excel, OneDrive Excel, or Google Sheets
- Split your screen as shown below such that you can see your spreadsheet and this guide document at the same time
arrow_upward back up to contents
motorcycleExercise 1: Gathering primary data
Exercise type: Interactive data gathering activity
- Brainstorm a question that is related to your field of inquiry. Also brainstorm a secondary question about the answerer of the question tha you can use to slice and dice the data
- Create a 1/2 page sheet that contains the background question, the core question, and a line that contains labels on each side representing extreme positions on your question. Respondents will actually place an X on the line to indicate their preferences
- Administer the tool to the entire class
- Create a spreadsheet in which each response has a single row in the table. Give each respondent an arbitrary ID, record the background data, and the response value.
- Caluclate the descriptive stats for the entire data set, then use sorting to do the same after slicing the data using the background question you designed, such as the respondent's previous degree status, or age, etc.
- Develop a defensible claim based on your primary data to share with the class.
arrow_upward back up to contents
buildModule Mini-Project: Comparing parcel values
Exercise type: Culminating Activity
Project steps
- Visit the Western PA Regional Data Center's property information extractor . Browse the municipalities and PGH neighborhood map. Choose either two PGH neighborhoods or two municipalities that do not include Pittsburgh (PGH as a whole has more properties than we want to deal with in this exercise). Choose two that might yield interesting comparative data, either because they might be very similar, or very different.
- Follow the steps provided in the bullet list below to download simple CSVs for your two chosen municipalities.
- In step 1, select either municipality or city of PGH neighborhood
- In step 2, select your custom fields: basically, the only three items you need are under Property Assessments called: "Fair Market Building Value", "Fair Market Land Value" and "Fair Market Total Value"
- Click: Use These fields
- Download the file as a CSV
- On most systems, this will result in a prompt to open the file in a spreadsheet, either Libre Office Calc or MS Excel, etc. Open it!
- Do this for both of your chosen municipalities
- Clean up your spreadsheets by copying the original tab to a new tab called something like "swissvale_cleaned". Then delete the column with the geometries, leaving only the parcel id number and the three market value columns
- Create an auto filter on all the columns
- Sort by the building value. Delete all parcels whose building has no value
- Make a note of how many properties you deleted in your work process log (just a word processing document0
- Remove any properties whose total value is $0
- Do this same process for your second property and copy that data into the spreadsheet with the original municipal data, so both of the data sheets are in the same spreadsheet.
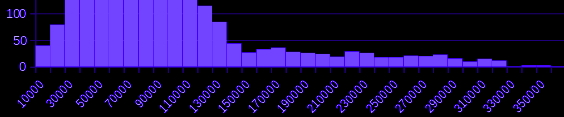
- Create a new sheet called "analysis" or something like this, and create a summary table and histograms that look like the sample below.
Sample outputs
A comparison of property values in Swissvale, PA and neighbor municipality called Edgewood
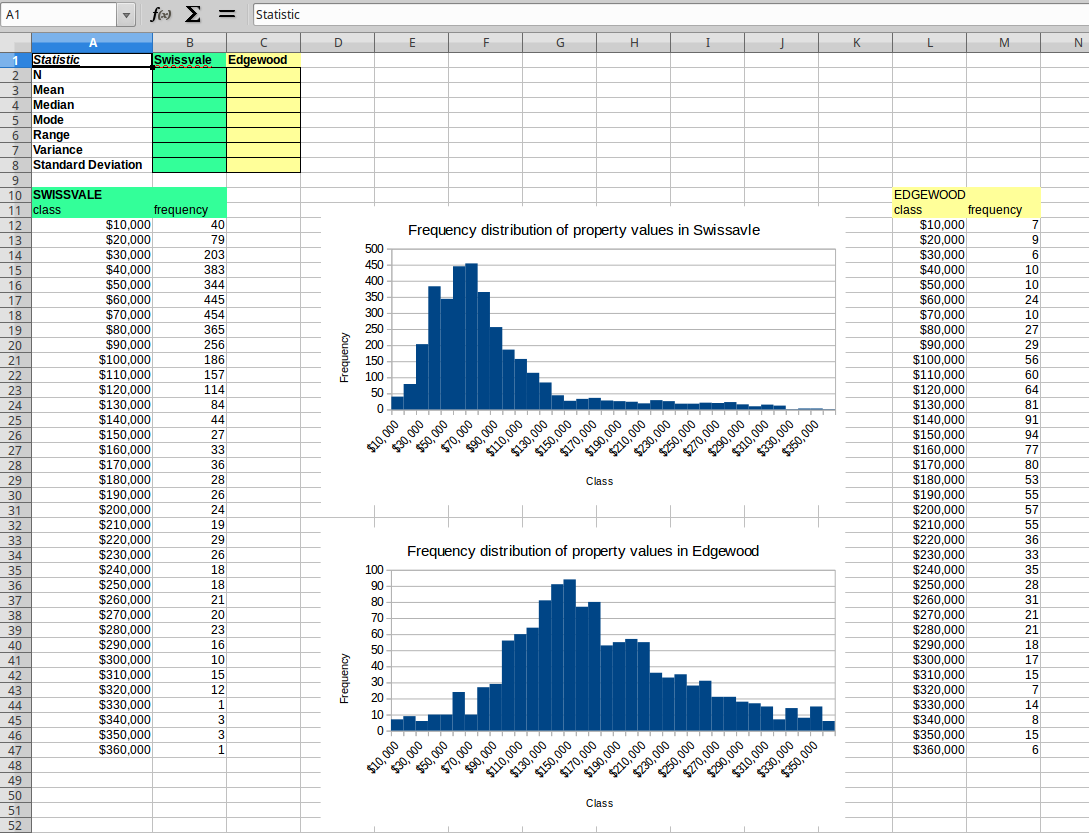
The set of spreadsheet tabs you might want to use

Submission guide
- Open our shared directory for DAT102. Navigate to the FA18_studentwork directory. Navigate into your named directory.>
- We want to upload both the tinkerable spreadsheet file as well as a digested PDF of your final analysis sheet, and both need to be named appropriately. Start by either saving your spreadsheet with this name or using "Save As" to make a copy of the file with the correct name like this: fa18_parcelValuesComparison_[firstname]. Be sure to replace [firstname] with your first name, not including the square brackets.
- Use a PDF exporting feature to export only the sheet called stat_comparison such that somebody could view that one spreadsheet page and the summary document and get a sense of your project.
Page created on 2018 and last updated on 2018 and can be freely reproduced according to the site's content use agreement.