data analytics master sequence > distributions and variance
wb_incandescentIntroduction
We stand alone in a dreary waste.
wb_incandescent1: Interpreting our strip survey box plots
Objective:
Interpret a set of box-and-whisker plots to chart an optimal decision outcome, such as a career move choice.

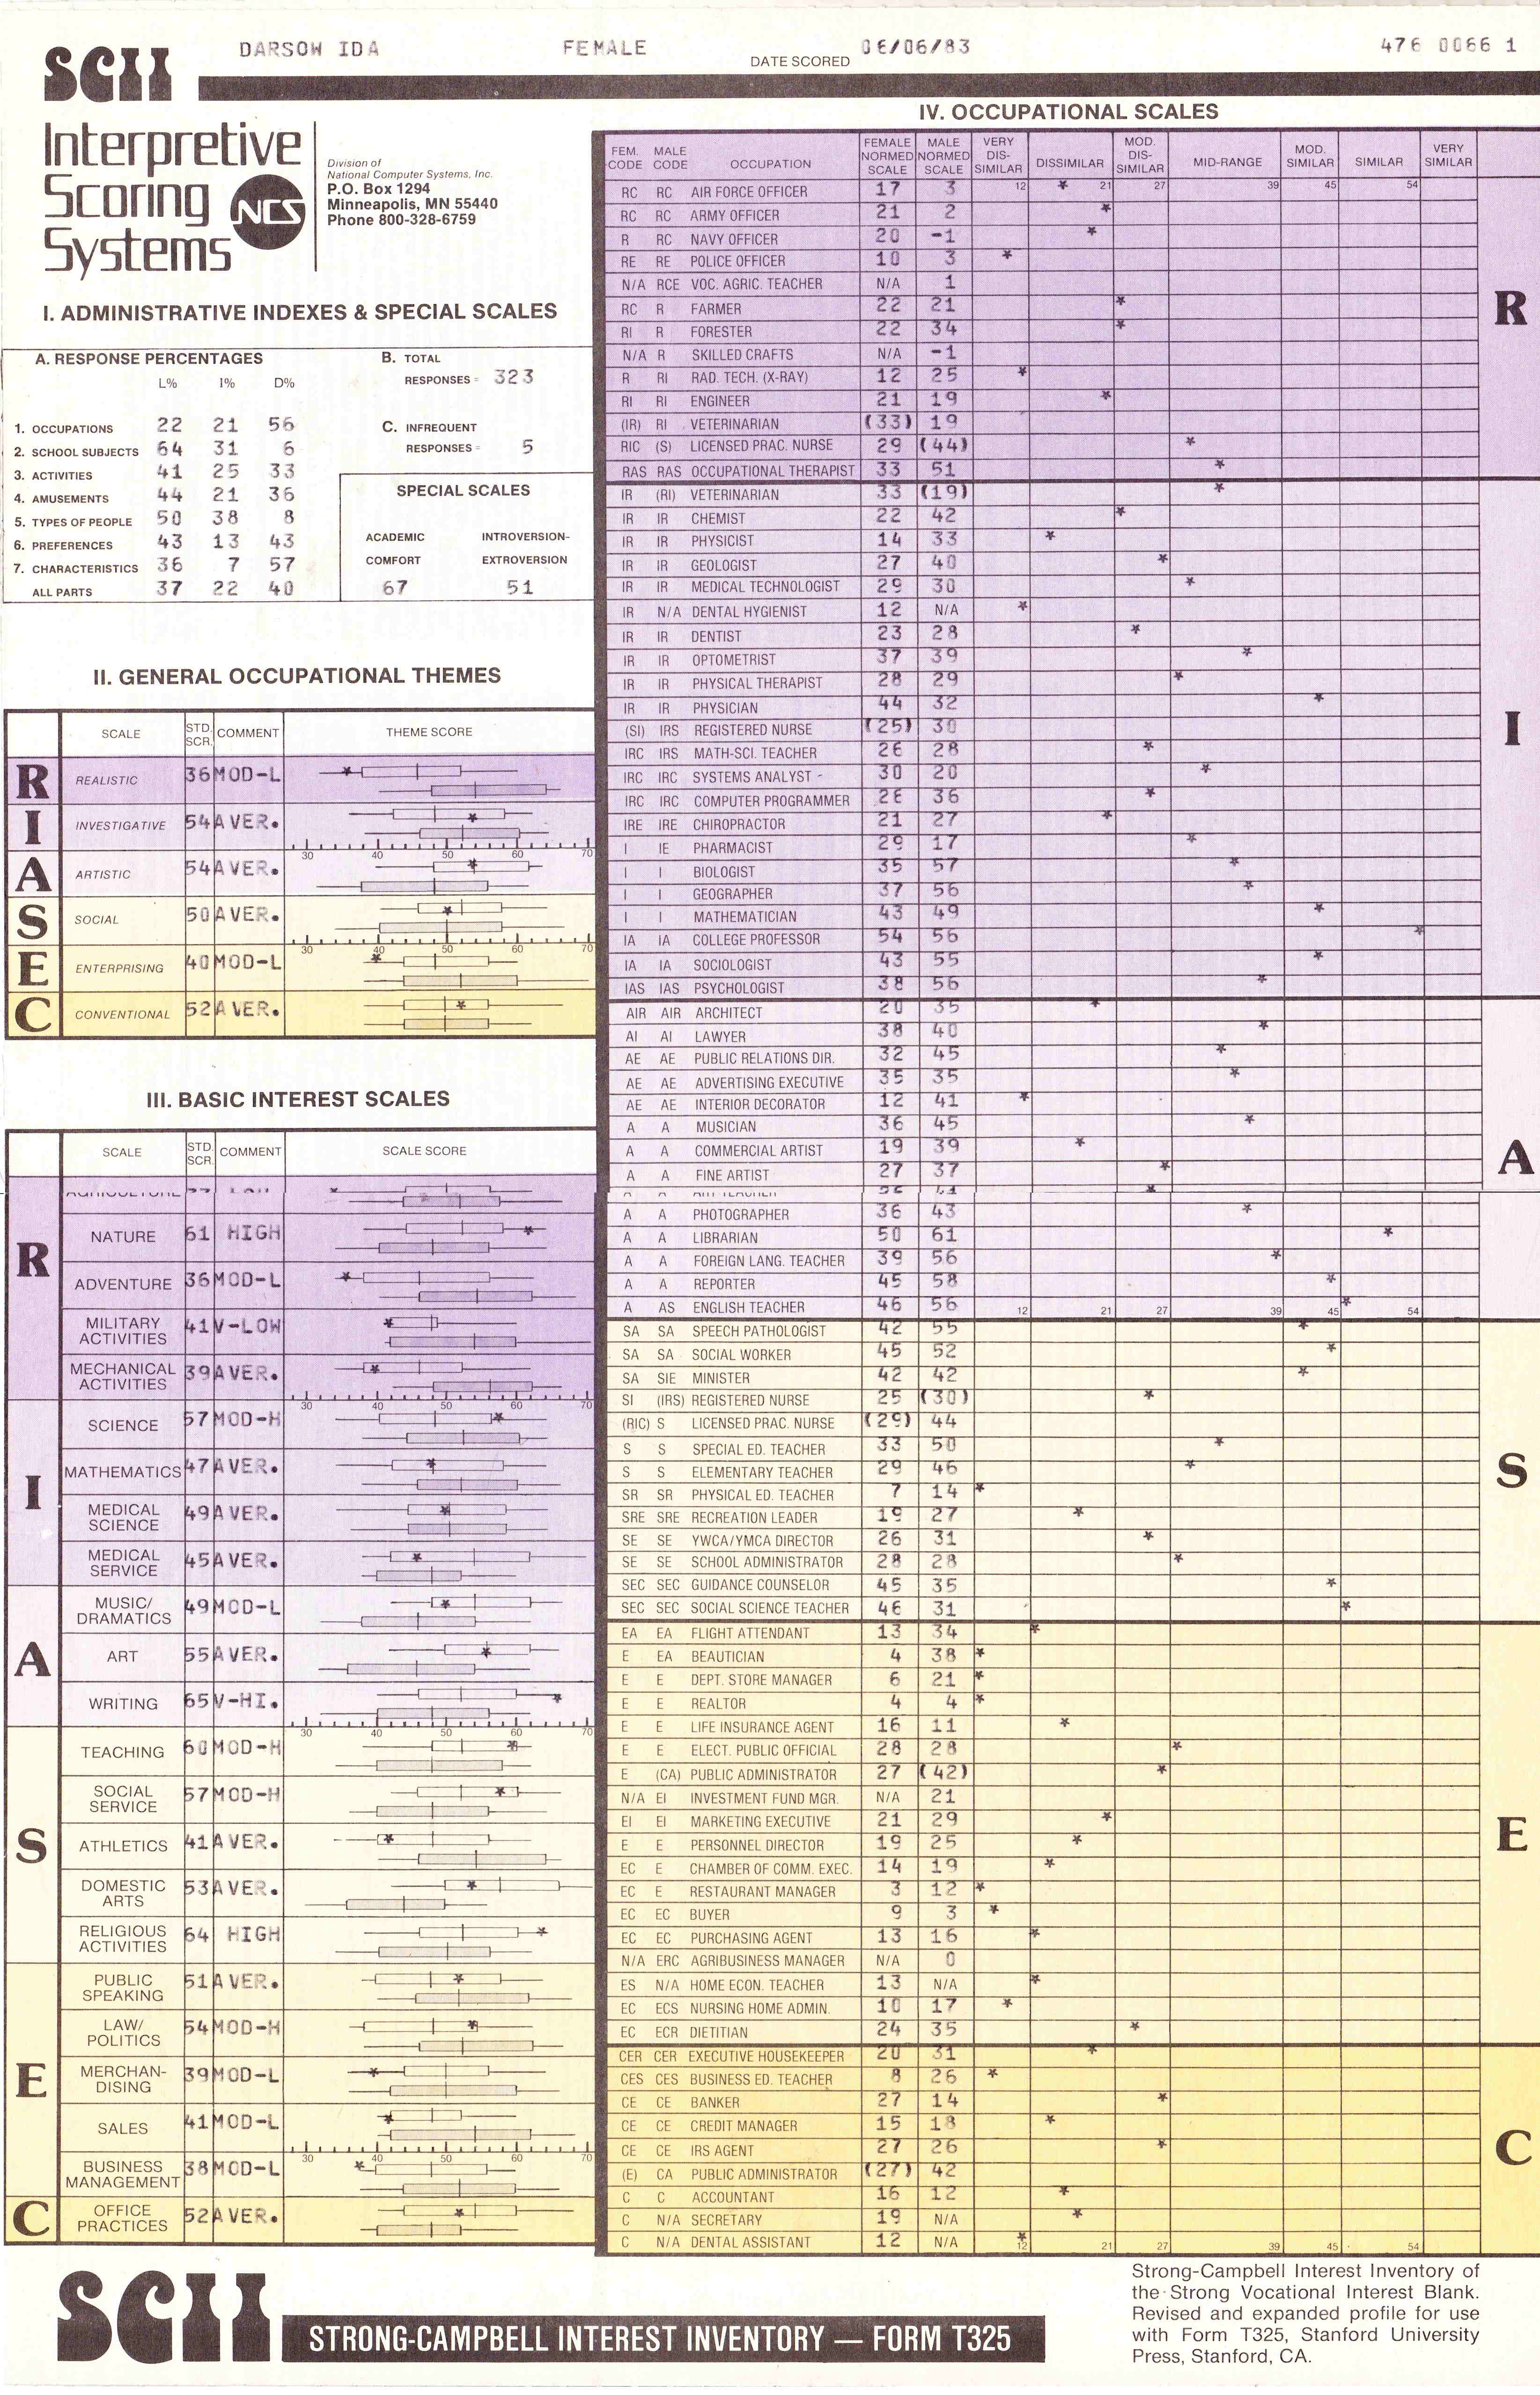
- Dedicate a few minutes to studying the scoring report--dated 1983!--created by a career analytics company called Interpretive Scoring Systems. Notice what your eye is frist drawn to?
- Note, in particular, how each Basic Interest Scale fow in the lower left contains a scale, a "STD SCR" "COMMENT" and "SCALE SCORE". Study the relationship between the categories used in the COMMENT column and the position of Ida Mae's representative star on the box plot. Summarize your findings in question 1.
- Although Ida Mae is no longer alive, provide a recommended career path for her in Q2.
- The score report contains heavily gendered feedback to the respondent. Study the gender differences evident in the data for various careers. Consider the "direction" of the gaps, and the size of the gaps. Reflect in Q3.
wb_incandescent2: Mean VERSUS median
Goal:
Describe the important research phenomenon of measurement error with actual quantitative data extracted from several measurements of the same set of strip surveys.
Steps:
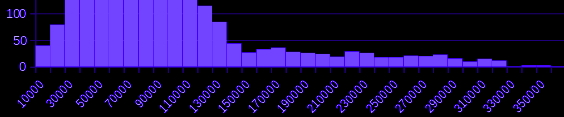
wb_incandescent3: Distributions & histograms
Goal:
Create hierarchical representations of organizational relationships and demonstrate how trees can also be encoded in plain text for reading into and out of a computer