Census-based policy evaluation
wb_incandescentIntroduction
The second in a two-module series built on the US Census Opportunity Atlas  , this module invites you to evaluate various social program ideas based on data drawn from this tool. If you haven't already digested the Atlas Module 1, do so before continuing this module.
Overview video
Submission
Please upload all your related documentation this exercise to this shared drive. Remember to use only your first name.
bookCore Concept: Program evaluation framework
Imagine you are working in an advisory capacity for a county or city-level administrator tasked with allocating limited public resources to public service programs designed by outside consultants. In typical consultant fashion, some recommendations came out of a churn-and-go attitude and would not be wise investments. Others, your boss believes, are sound and worthy of public funds. Consider the following sequence for evaluating these programs:
- Read the program proposal carefully
- Identify the population subgroup(s) the recommendation claims to benefit
- List the key metrics used for evaluating the effectiveness of a given program
- Scour The Atlas to gather as much primary data related to the locations of concern in the proposal
- Position the proposal and your data side-by-side and look for convincing data bits to support the overall recommendation and policy structure.
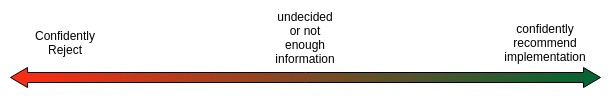
- Boil your recommendation down to a location along a spectrum of confidently reject, inconclusive, and confidently recommend.
- Defend your overall recommendation using a handful of clear, data-backed claims that connect your data with the program aims and mechanisms.
Evaluation spectrum
Prepare to justify each of your overall program judgments
Policy Proposal 0: COVID-19 Vaccine distribution
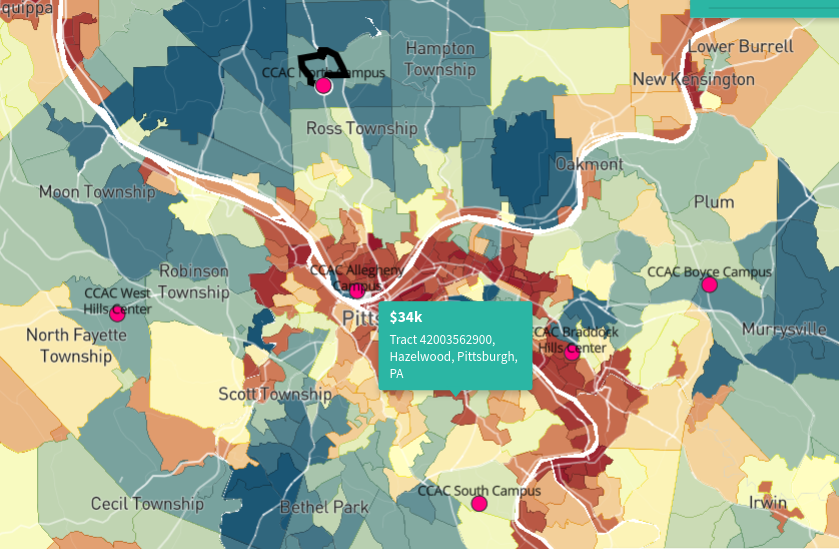
We can use the non-parent-to-child outcome data sets built into the Opportunity Atlas to explore a dozen or more neighborhood characteristics down to the Census tract level. Use these "Neighborhood Characteristics" layers to determine the optimal location for distribution of COVID-19 vaccines if CCAC campus centers are selected as innoculation sites.
Location
Allegheny County, PA
Setup
Step 1: Download point file
Download this tiny spatial data file encoded in the geoJSON format (1.2kb) from the Technology Rediscovery server which contains points for each of our CCAC campuses, West Hills, and Braddock Hills. Save it in a location for re-upload to the Opportunity Atlas.
Step 2: Upload points to Opportunity Atlas
Open the Opportunity Atlas mapping tool if it's not already open in your browser.
Click the button in the lower left called Overlay Your Data >> Choose the file you just downloaded called CCAC_Campus_points.geojson
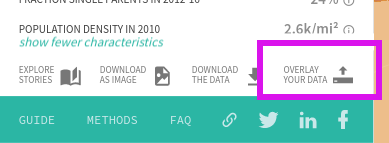
When imported choose a color for the map points. When imported, you should see the points like the image below
Policy structure
Create TWO rankings of Campus centers to receive the Vaccine as it becomes allocated to Allegheny County. One should prioritize minimizing deaths from the virus, and the second ranking should prioritize minimizing additional transmission of the disease.

Program Proposal 1: Opportunity down the street
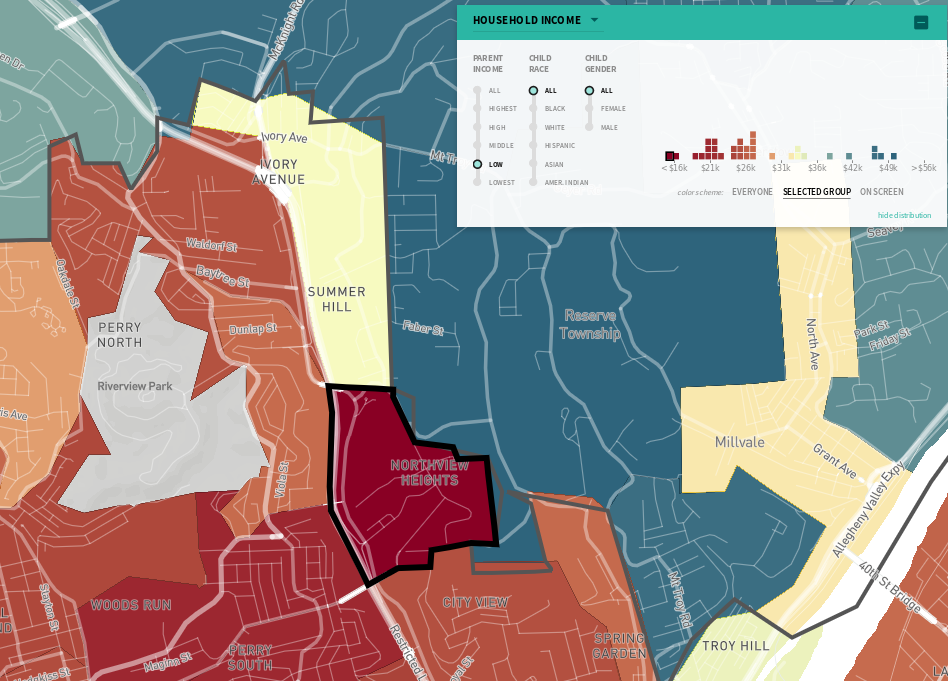
The core policy ideas that emerges from The Atlas is that folks of a given income can achieve much more positive outcomes in some locations compared to others--even within their own municipality. This program is designed to provide moving vouchers to families and individuals in a single tract if they decide to move to nearby areas.
Location
Pittsburgh's north side
Program structure
Housing voucher are offered to residents in Northview Heights whose family/parent income is in the 25th percentile or below (low income) based on where they choose to move. The following table shows the monthly voucher amount provided based on your moving destination. The program funding allocation is based on a total program budget of $10m, with a fraction used for overhead management costs and not distributed as vouchers.
| Destination neighborhood | Monthly voucher amount | Program funding allocation |
|---|---|---|
| Reserve township | $450 | $1m |
| Summer hill | $280 | $2m |
| City view | $600 | $5m |
| Perry south | $300 | $1m |
Guiding Atlas map
This screen clip shows the program area in The Atlas with household income displayed for children whose parents were in the low income bracket.
Key outcome measures
Success in this program is measured by the percent of allocated program funds used to pay vouchers in the intended neighborhood.
Evaluation focus considerations
This program is based on household income outcomes and median rents from 2006-2010. You'll want to be sure to evaluated the program fund distribution by correlating the outcome measure with the neighborhood characteristic.
Group Inquiry:
In your group, rate the proposed allocation of funds on a scale of 1 to 10, with 1 meaning extremely disapprove of the proposed allocation and 10 meaning completel approve. Write your group names, your rating, and any changes you'd make to the allocation on your colored sheet of paper.
Program Proposal 2 overview: Young, single mothers
Women who have children in their teens are at much higher risk for suffering from poverty later in life. Census data suggest that families from lower income quarties are more likely to have women children who, later in life, give birth in their teens.
Location
South East of Pittsburgh City: Braddock, rankin, North Braddock, Homestead, Duquense, etc.
Program structure
Designers looked at percent of teenage women who give birth based on parental income. Since supporting women who have children at a young age can help both the mother and the child for years to come, this program is designed to connect young mothers with jobs close by where they live.
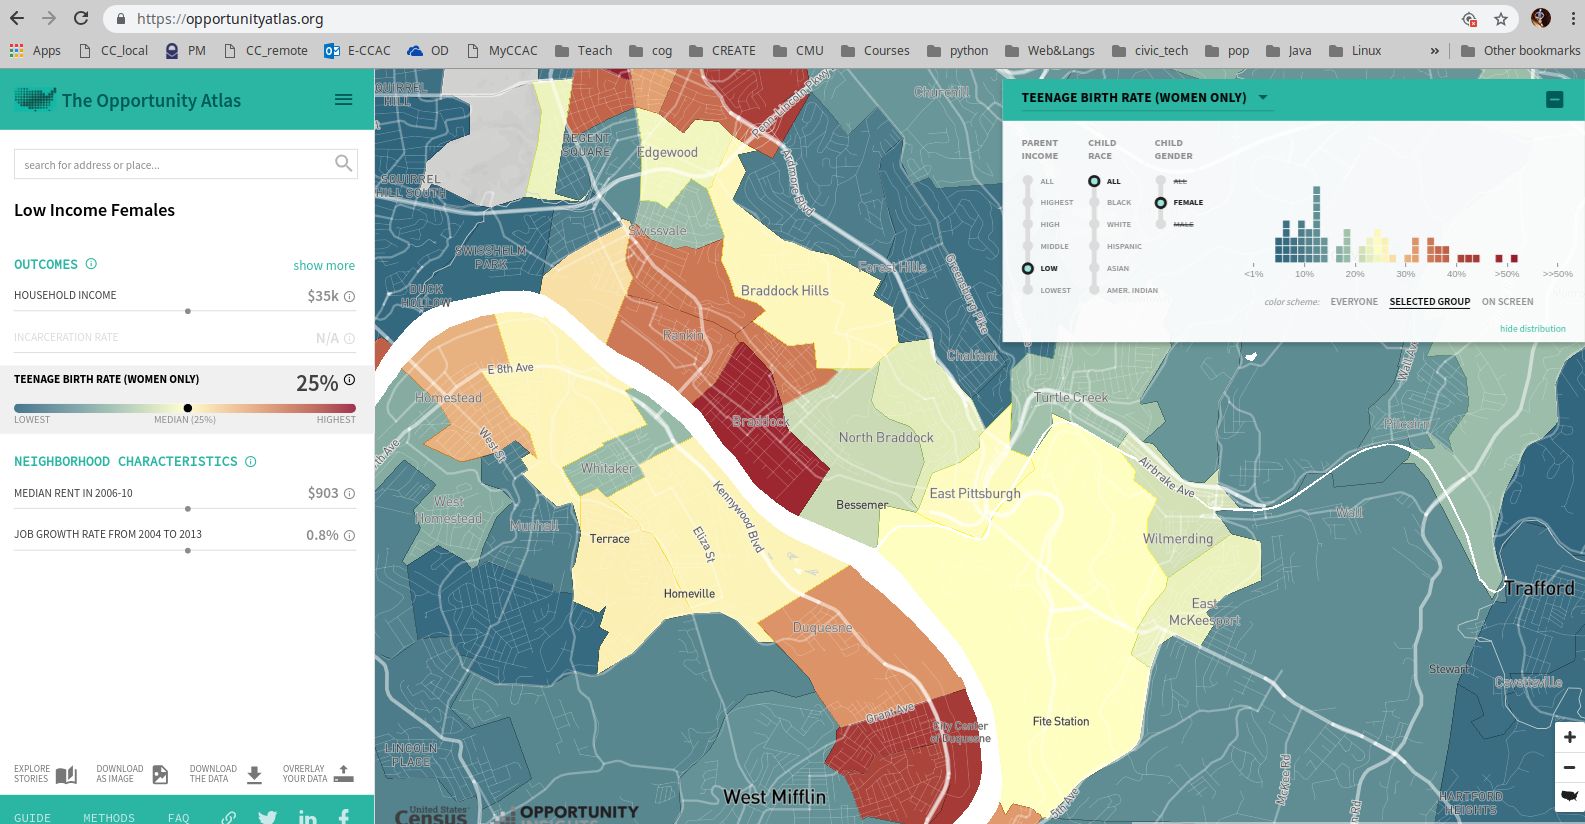
Employment center support
Based on The Atlas data, Job Growth from 2004 to 2013 is unevenly distributed in the region. This program seeks to place JobCorps and other post-college students looking to serve communities for a few years after college with employment agencies in high-growth areas. Planners have prioritized these municipalities for placement:
- Braddock
- Duquense
- North Versailles
Key outcome measures
Number of teen mothers who find part or full-time employment at above $15/hr.
Group Inquiry
Rate your group's confidence in this program's ability to promote solid employment by young mothers on a scale from 1 to 10, with 1 being zero confidence in the program, and 10 being perfect confidence. If not rating a 10, what weakens your confidence?
Program Proposal 2 overview: Race-based scholarships
This program offers merit-based scholarships to graduating high school seniors and uses race as a factor in alloting funds. Designers argue that since race was historically used to deny rights and privileges to folks, race should be used in determning aid.
Location
Bridgeport, Connecticut
Program structure
Since learning about The Atlas, scholarship founders have decided to weigh applications by applicant's home census tract and parental income, in addition to merit achievement and race.
Position your map to look at the Bridgeport and Stratford area:
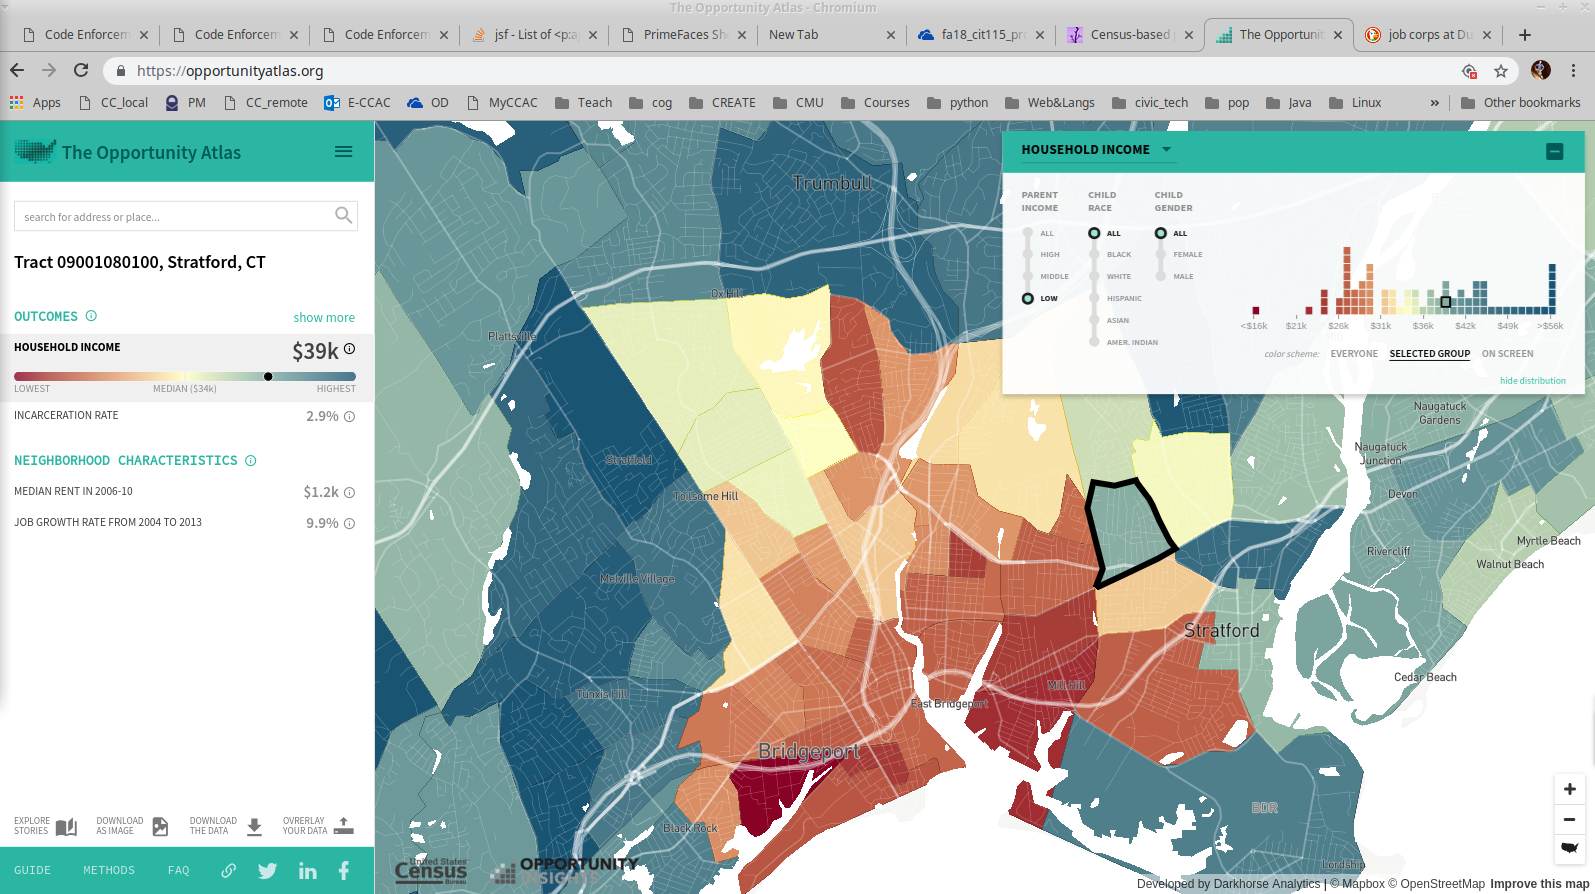
Scholarship point weighting:
| Tract | Weighting (point multiplier) by demographic |
|---|---|
| Tract 09001080100, Stratford, CT | 3x for black applicants, 2x for white |
| Tract 09001073800, East Side, Bridgeport, CT | 3x for Hispanic applicants, 1x for black |
Key outcome measures
Comparison of graduation rates of students from the same socioeconomic categories between those receiving scholarships and those not receiving scholarships
Group Inquiry:
What data-based outcomes could justify differing point weightings by race in a given tract?
Would you re-allocate the points in the chosen tracts differently by race?
If you conducted separate allocations of scholarship dollars for low and middle income parents, would you use similar or different allocations?
Atlas In Action Evaluation: Bill Bynum of Hope Credit Union (Profile 2)

Location
Alabama State
Inquiry background
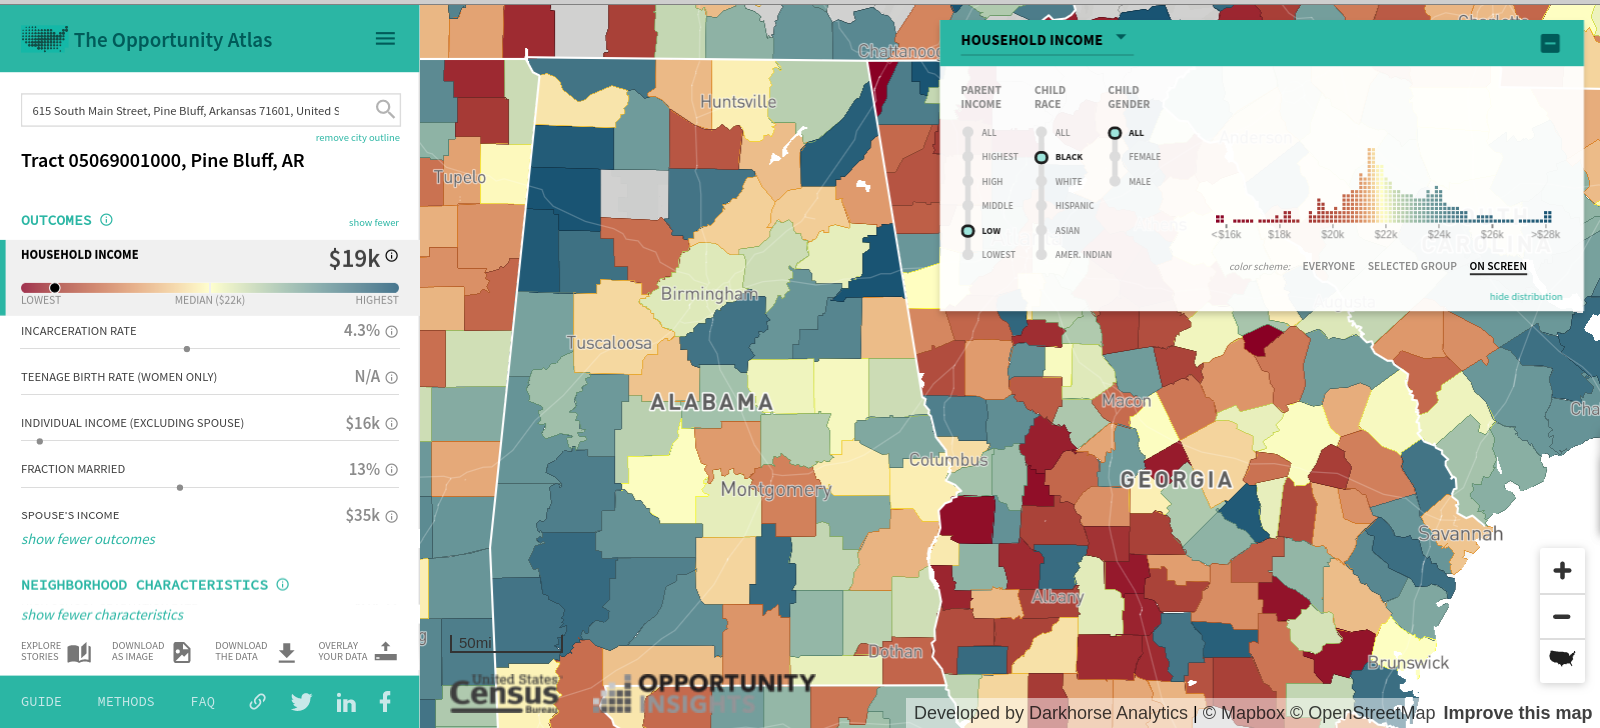
Bill Bynum sees data as way of formulating a community investment strategy. As of the writing of this task, Hope Credit Union operates 2 branch offices in Alabama, both in the Capital city of Montgomery.
Proposed Atlas slices
Review the following clippings from the Atlas which were recommended to you by colleagues who conducted a similar analysis in another state.
Cohort household income of White folks whose parents hailed from the bottom income quartile
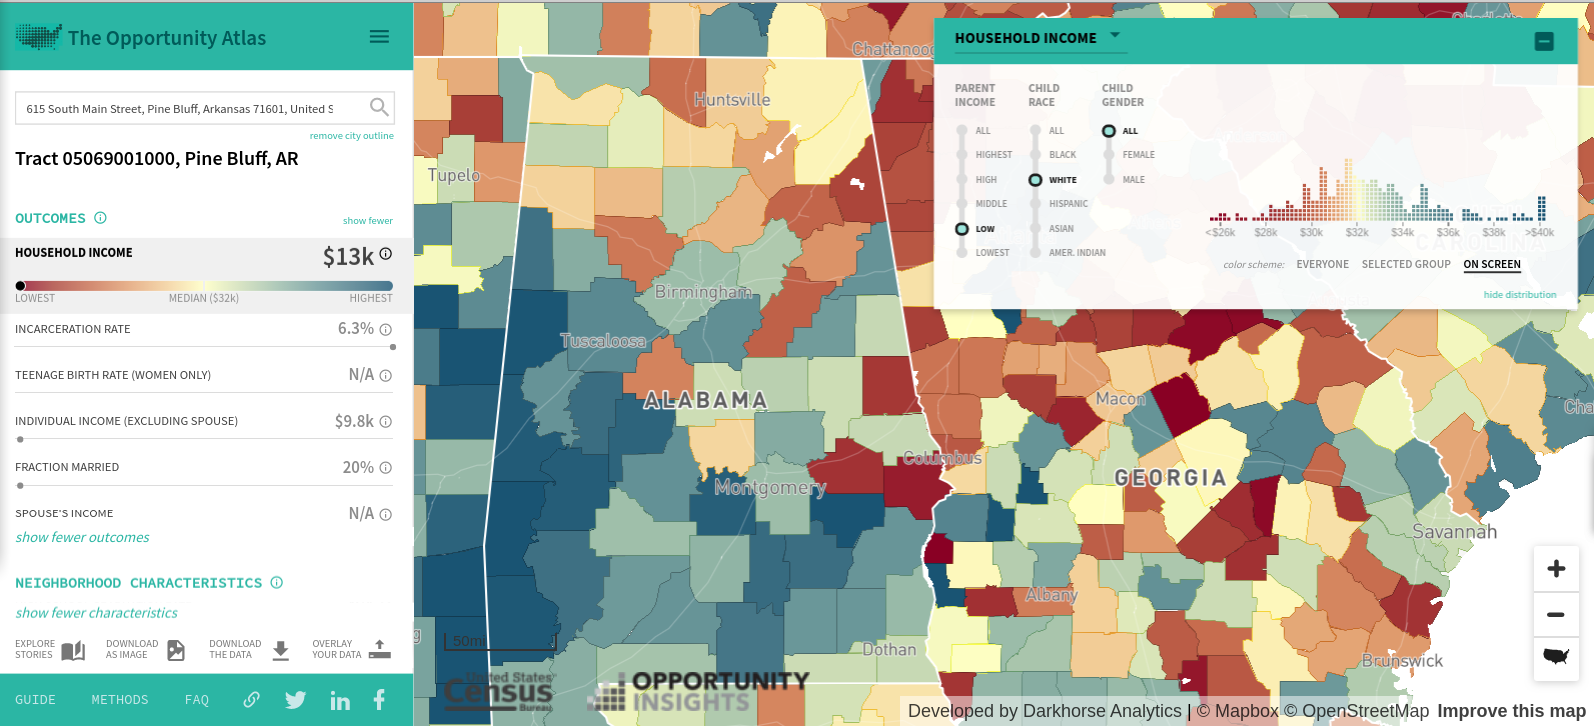
Cohort household income of Black folks whose parents hailed from the bottom income quartile
Mini-Task
Since Mr. Bynum's bank is investigating expansion to other parts of Alabama, explore the landscape of opportunity in Alabama carefully, paying close attention to the major cities.
a: Generate a recommendation of three cities you believe would provide a chance for Hope Credit Union to do as Mr. Bynum aspires: to "help hard working people climb the economic ladder". Please rank order your city choices
b: Justify your rankings in a few sentences: Explore sub-questions such as: What data layers and display settings helped you to make the choices of cities you did? What were your priorities in choosing cities? Did your group differ in its assessment of the priorities?
Focus questions
c: What are the limitations of your recommendations? What additional data if any would you suggest assembling to make the final expansion decision?
d: What color scheme choices in the Atlas distribution settings makes the most sense for your analysis in the state of Alabama? Why?
Submission
You and your group should assemble and submit at least one master copy of your overall recommendations along with screen clippings from the Atlas to back up your recommendations
Atlas In Action Evaluation: Pete Buttigieg

Location
South Bend, IN
Inquiry background
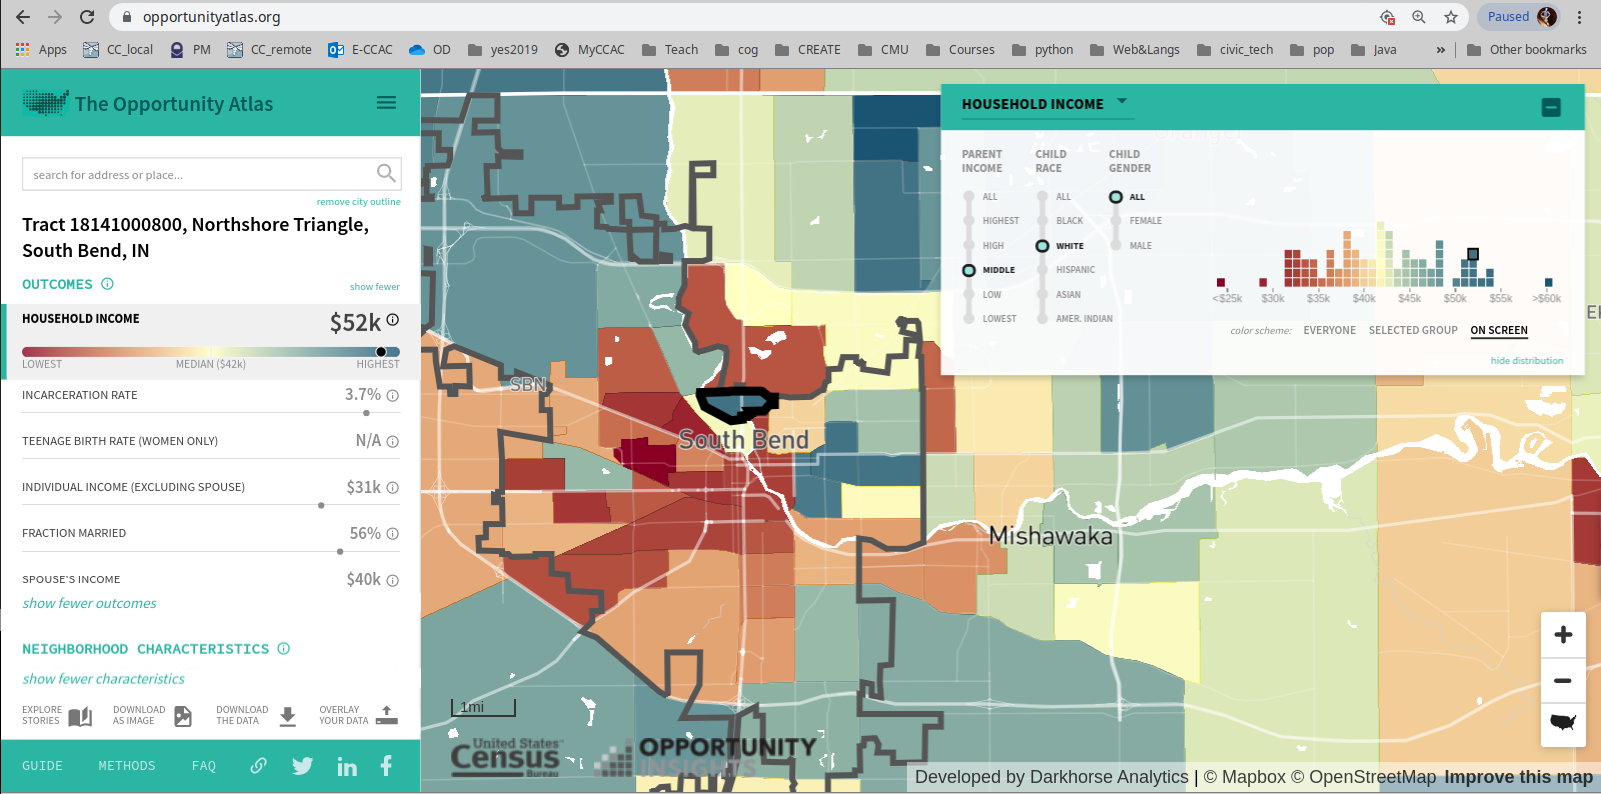
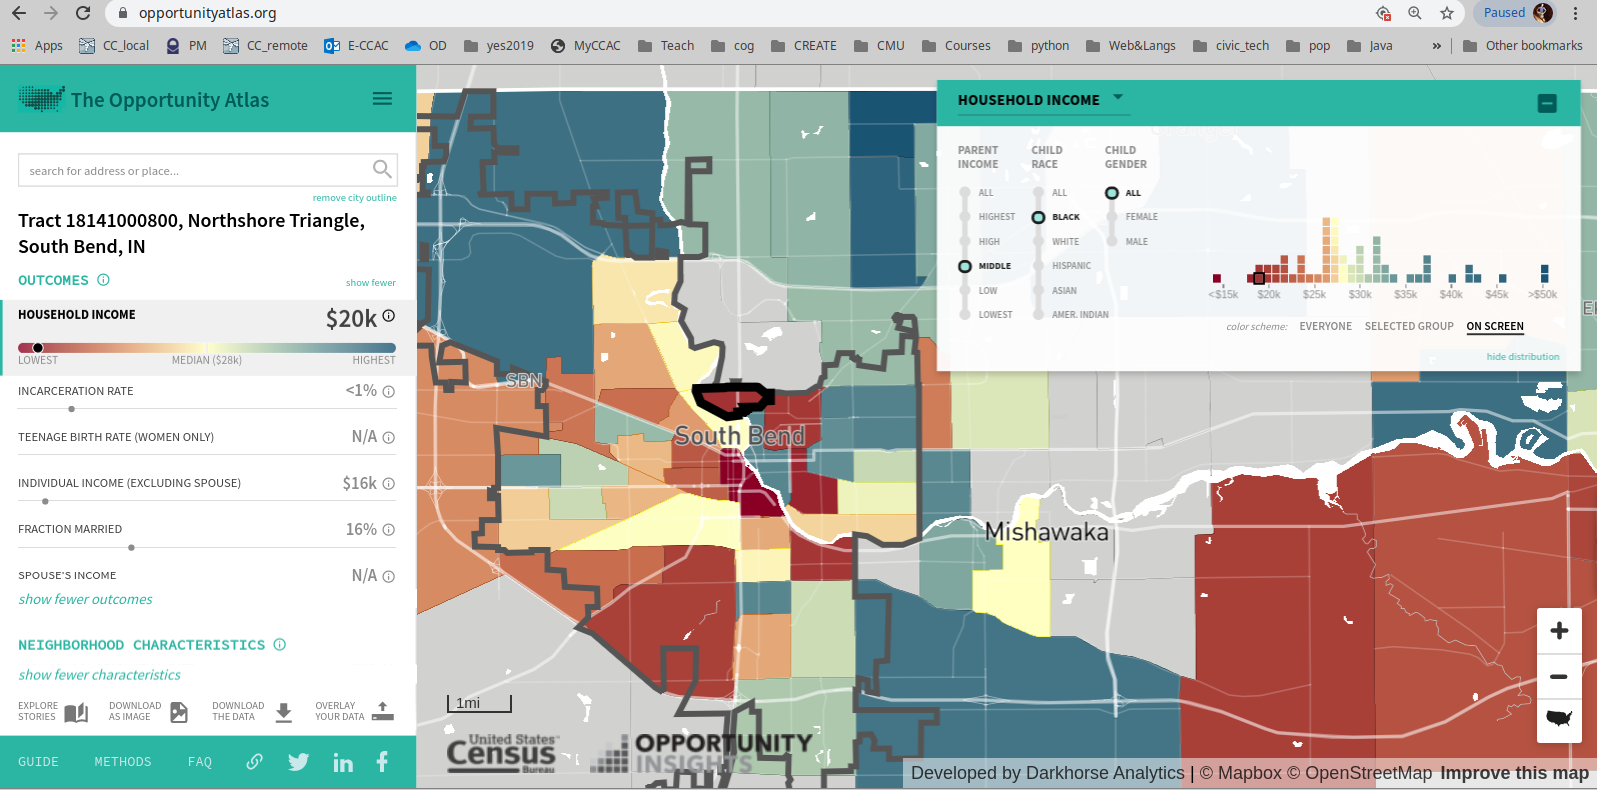
Pete Buttigieg is currently Mayor of South Bend, Indiana where he is focusing on income mobility promotion a at the neighborhood level. In fact, his office has produced what he terms Opportunity Zones which are census tracts declared to be ripe for further community development.
Proposed Atlas slices
Review the following clippings from the Atlas which were recommended to you by colleagues who conducted a similar analysis in another state.
Cohort household income of White folks whose parents hailed from the middle income quartile
Cohort household income of Black folks whose parents hailed from the middle income quartile
Mini-Task
a: Carefully study the Mayor's Opportunity Zone map and supporting documentation. His economic team is using the notion of Opportunity more broadly than the Opportunity Atlas.
b: to what degree does Buttigieg's Opportunity Zones reflect an opportunity area as defined by the Opportunity Atlas' cohort study? Answer in a few sentences with data to back up your claim.
c: Using map clips from both Mayor Buttigieg's proposals and the Opportunity Atlas, evaluate his Opportunity Zones against desired direction of key outcomes described by The Opportunity Atlas.
Focus questions
Moving to Opportunity(MTO) Longitudinal study results
Review the findings from the massive, groundbreaking "Moving to Opportunity" study by the HUD and MTO programs. The glossy report is here. | A 10-page summary. | Full final and interim reports from huduser.gov.
d: Even given your early analysis of this approach to policy making, to what degree do you believe Buttigieg's Opportunity Zones represent a location to which residents in low opportunity zones could be subsidized to move (as in the treatment group of the MTO study)?
Related focus questions
e: How the race of resident impact incentives or policy structure around Opportunity zones in South Bend? To what degree do you appraise the treatment of documentable race-based descrimination sufficient in the plan shared by the Mayor?
f: In what ways does the report suggest economic development in areas of South Bend will likely to impact the key outcome variables and neighborhood indicators built into the Opportunity Atlas?
Submission
You and your group should assemble and submit at least one master copy of your overall recommendations along with screen clippings from the Atlas to back up your recommendations